vulnerability TO extreme weather
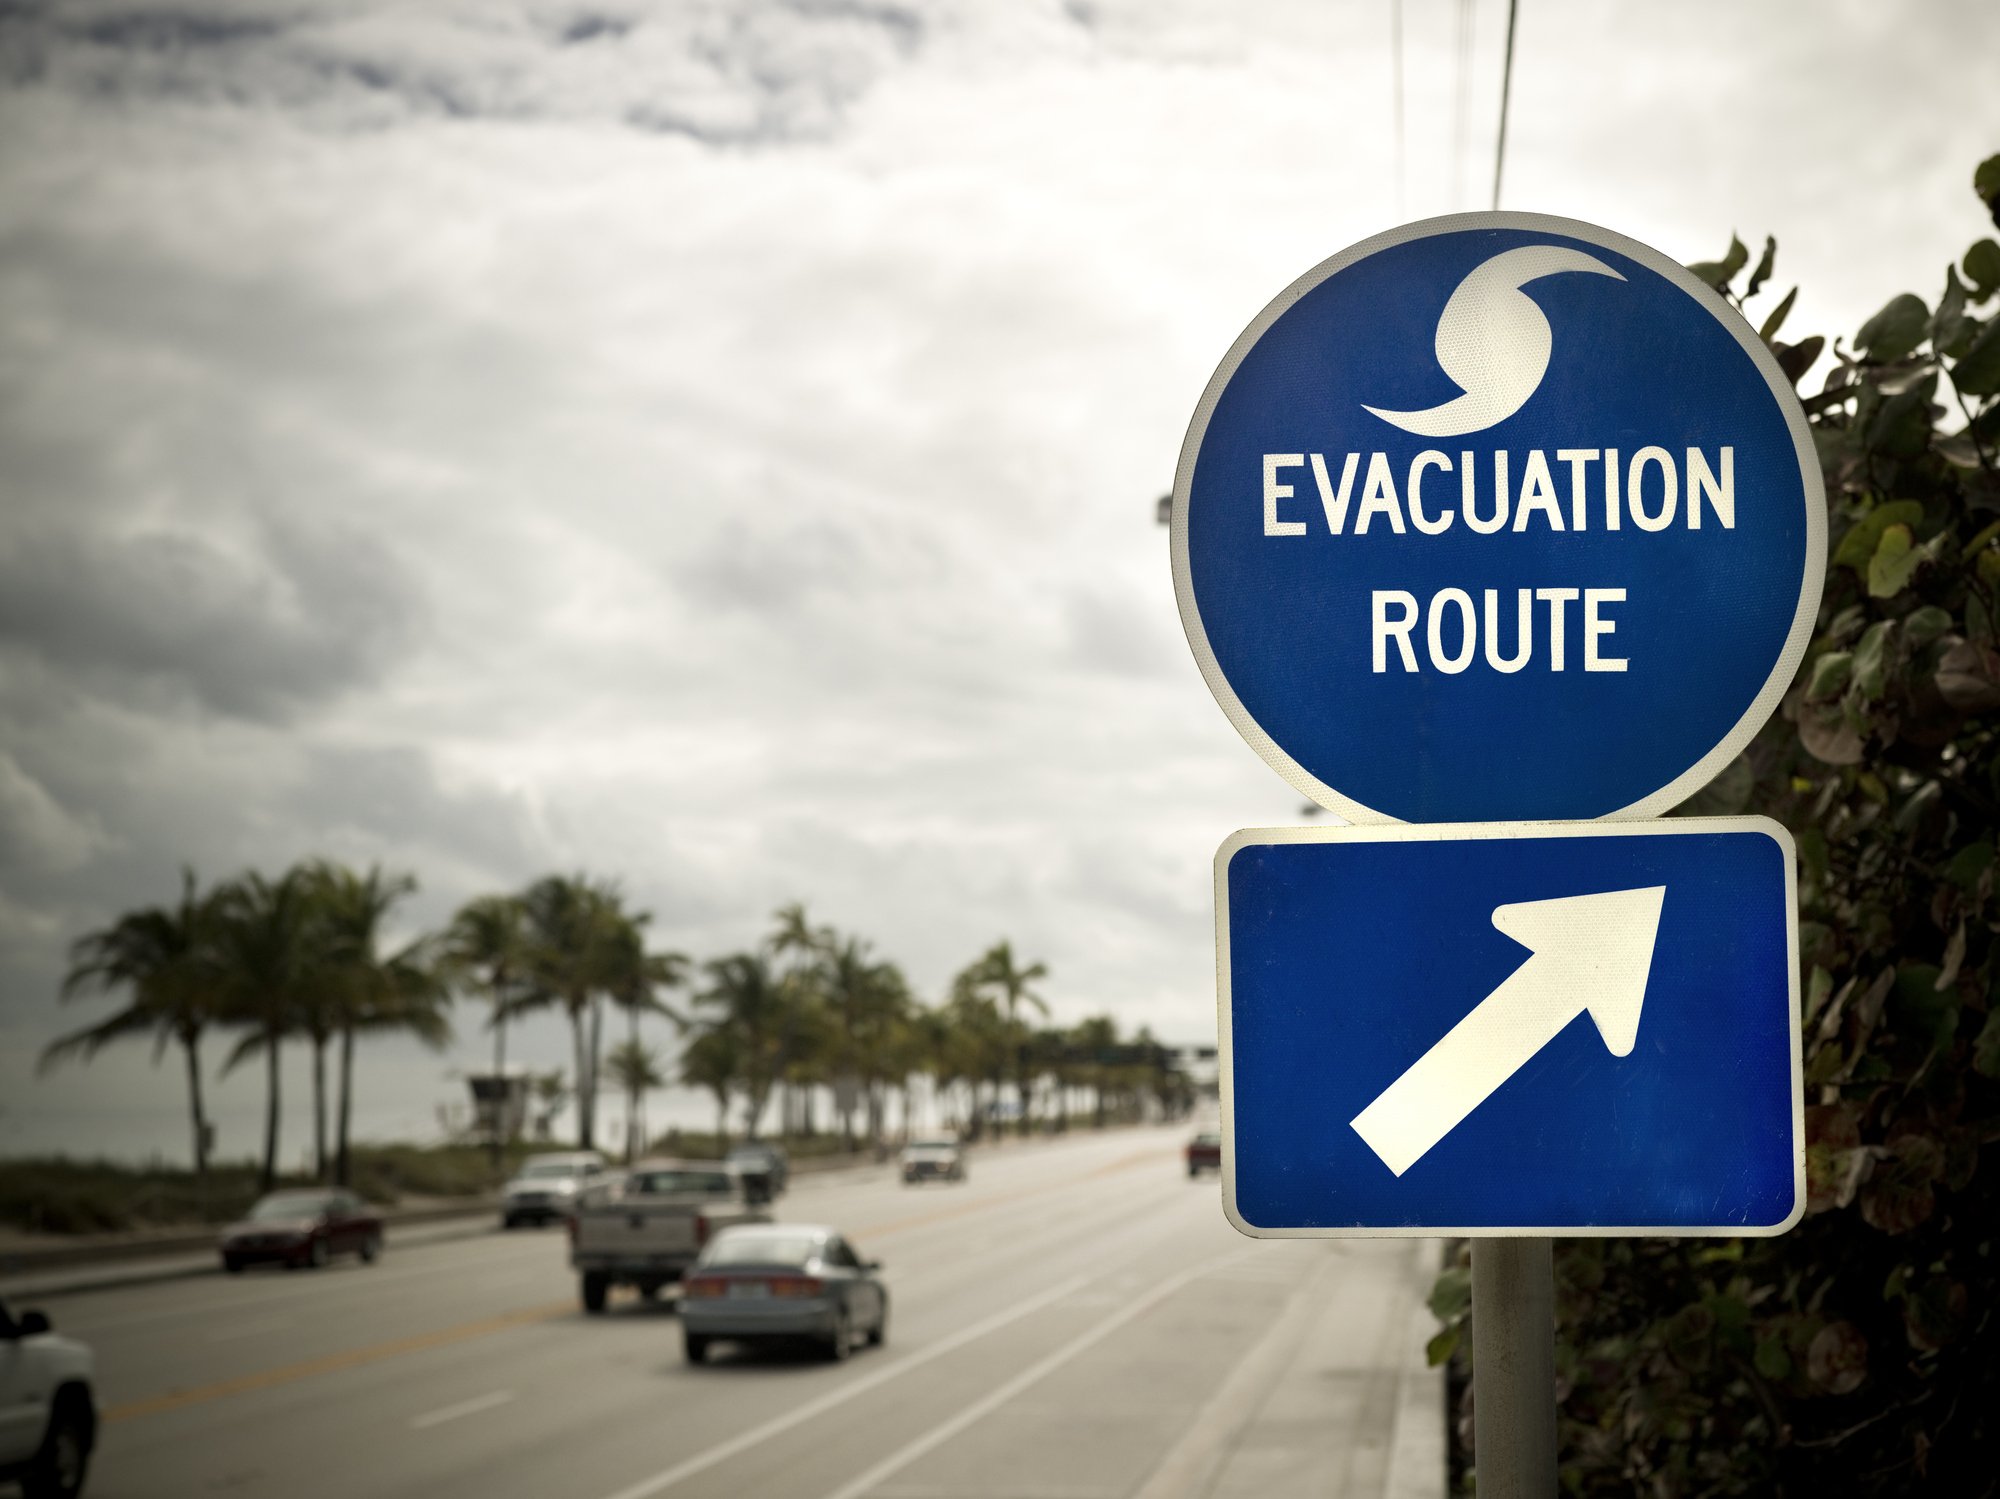
People have a right to protection from extreme weather events. Below you can find data sources to help determine your vulnerability level.
Extreme weather can result in loss of life and injury as well as loss of shelter, businesses, and critical infrastructure such as roads, power lines, and power plants. In 2023, there were 28 extreme weather events that resulted in at least a billion dollars’ worth of damages, according to the Federal Emergency Management Administration (FEMA). The total cost of these events was $92.9 billion.
Use the FEMA Risk Index to investigate which areas of the U.S. are most vulnerable to different kinds of extreme weather.
FEMA Risk Index Instructions: Open Tool > At the top-left, click the drop-down arrow next to Risk Index. Choose the type of weather event you are interested in. Just below, click Census Tract View, as this will show you a more detailed map than County View. On the map, grey and dark blue= areas of low risk, yellow= moderate risk and red= high risk.
To calculate the risk index, FEMA takes into account expected financial loss from extreme weather, social vulnerability, and community resilience. In other words, the index considers things that could either exacerbate or lessen the impacts of a weather event.

U.S. Drought Monitor
The U.S. Drought Monitor shows which areas of the country are currently experiencing drought, including those experiencing short and long-term drought conditions. Short term droughts can affect affect agriculture, whereas long term drought can have deeper effects on land form, hydrology (water movement), and ecology.
Drought Monitor Instructions: Open Tool > Darker colors on the map indicate more severe drought. S indicates a short term drought, while L indicates a long-term drought. If both are listed, the area is experiencing both.