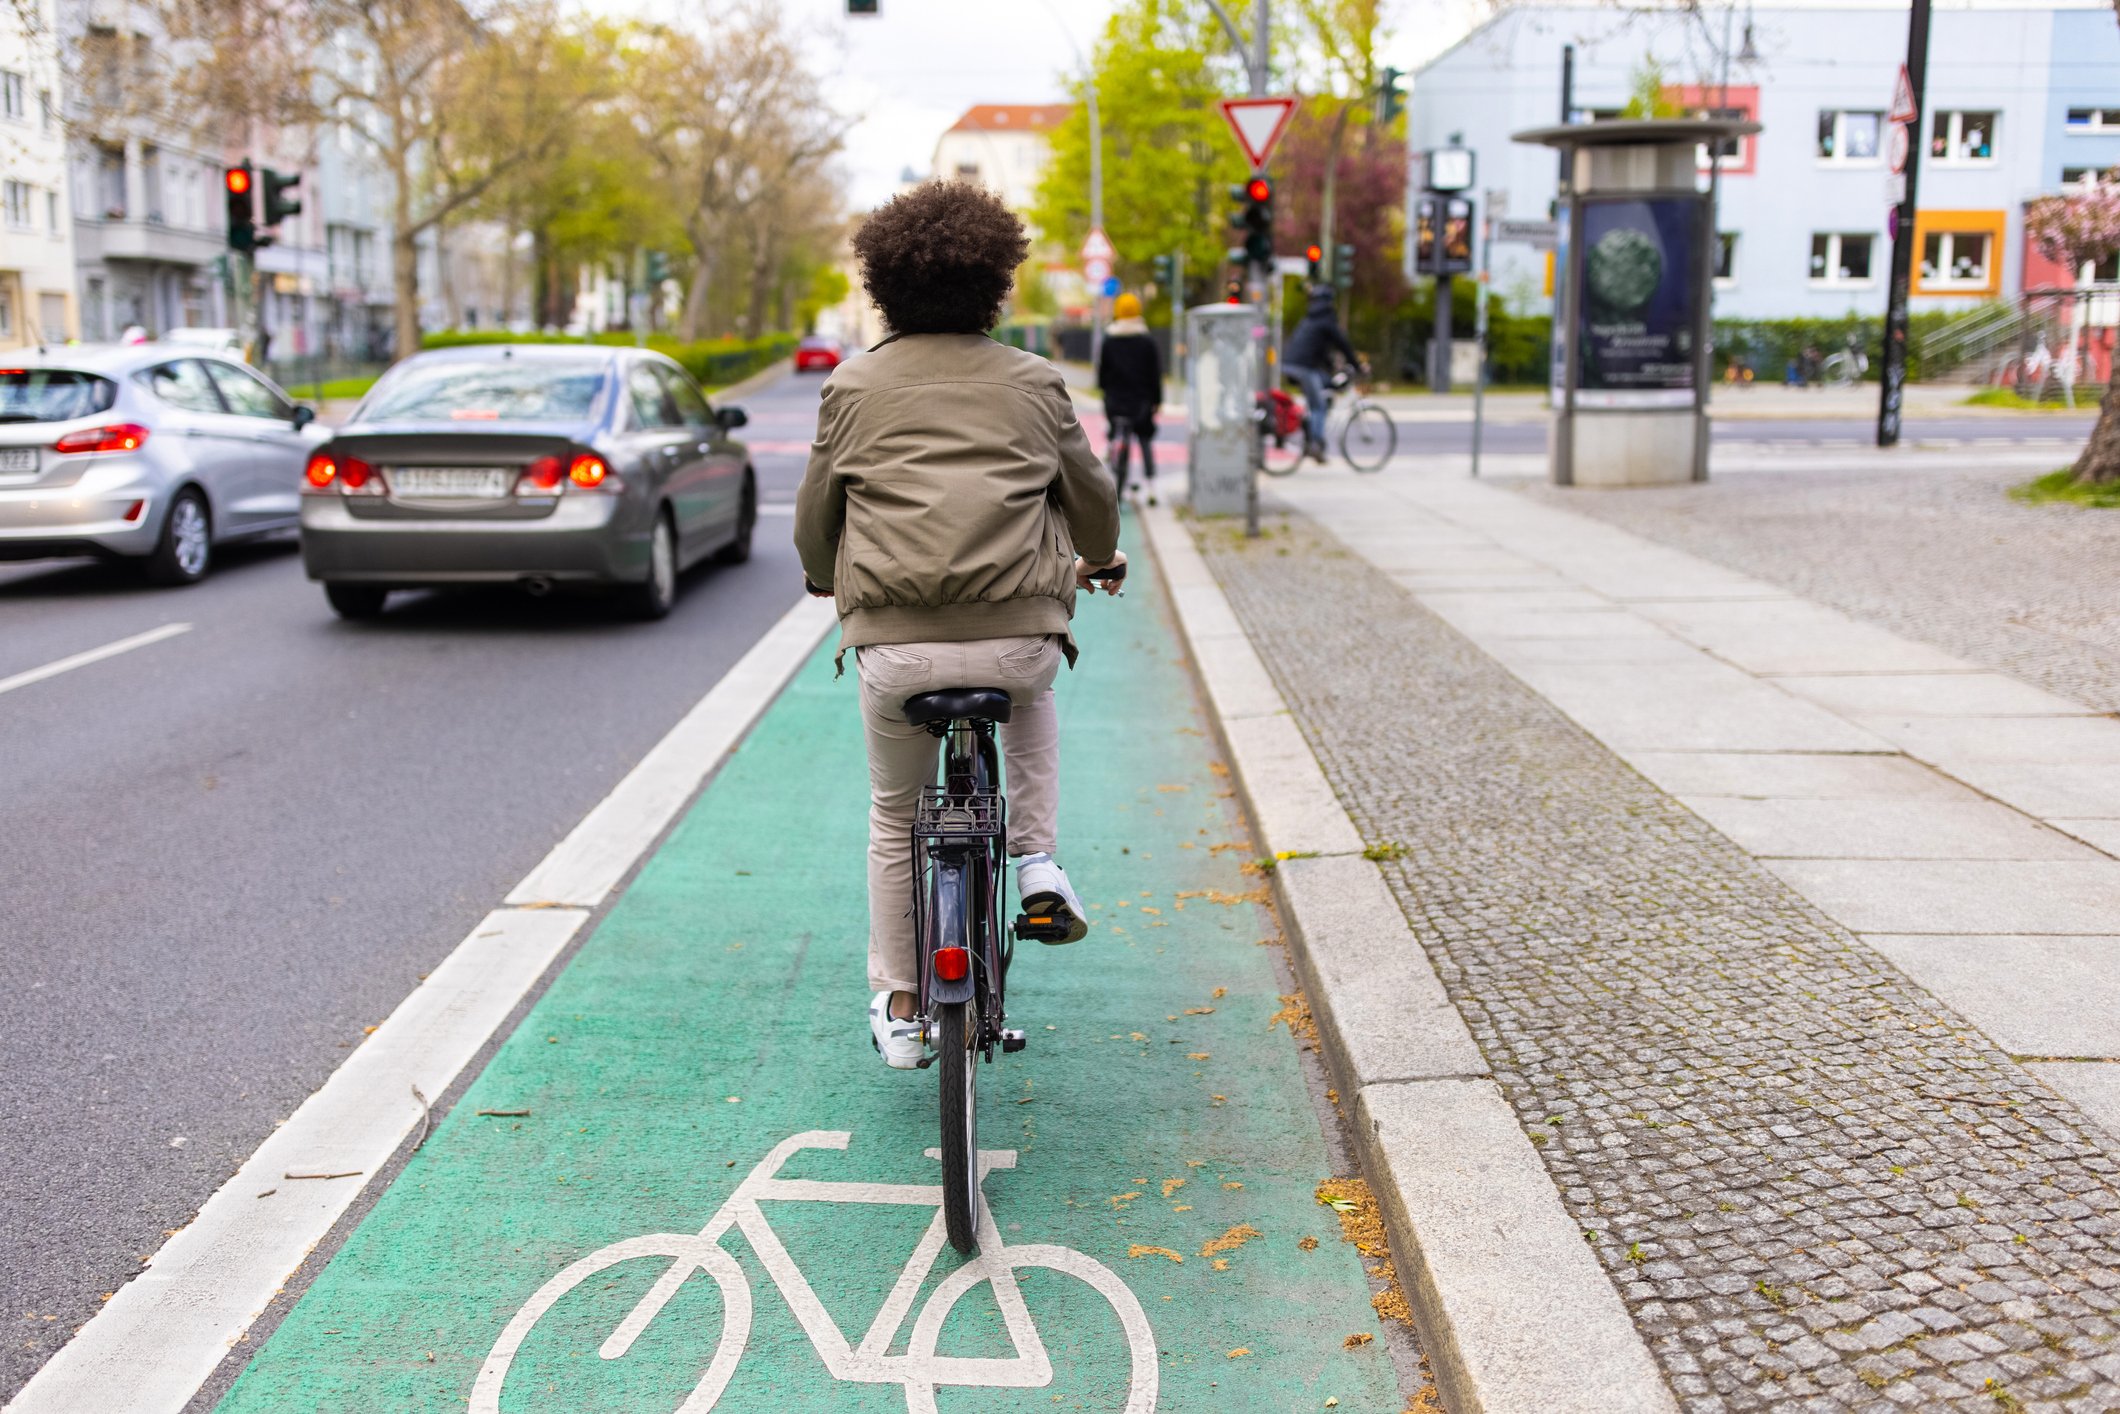
People have a right to access affordable, high-quality transportation, including safe biking options. Below you can find data sources to help determine your access level.
ACCESS TO safe bike options
Biking is a cost-effective form of transportation. It can also reduce traffic congestion, as cyclists take up less space than cars. Biking encourages people to be physically active, which can improve individual health and reduce public health issues, such as diabetes and obesity. Biking instead of using a car reduces pollution, improving human and environmental health. These benefits are only possible if people have safe places to bike, however.
People should not have to own a car to meet their transportation needs. Public transit should provide service between cities. Within cities and suburban areas, a person should be able to safely bike between any two places.
This is achieved in the model city of Copenhagen, Denmark via a combination of dedicated bike lanes and slow, shared streets. Most major streets have safe, dedicated bike lanes running in both directions, and minor, side streets have low speed limits, making them safe places for cyclists and motorists to share the road. Additionally, a culture friendly to cyclists results in motorists expecting to share space with cyclists. As a result, over 50% of commute trips in Copenhagen are by bike.
Open Street Map has an global map of bike routes. It shows which streets have various types of bike lanes.
A person should be able to bike between any 2 points using a combination of shared streets with speed limits under 10mph and dedicated bike lanes next to major streets, without having to go too far out of the way. As least some major streets should have bike lanes (they don’t all need to—2 major streets close to and parallel to each other don’t need to both have bike lanes). Use the map to investigate the prevalence of bike lanes.
Examine bike infrastructure in your area. You can easily compare this to cities known for high quality bike infrastructure, such as Seattle, WA (or, internationally, Copenhagen & Amsterdam).
Which major streets have dedicated bike lanes?
Which minor streets have speed limits under 10mph?
How many separate cycleways are there?
How many streets have cycle tracks (bike lanes) on both sides? Compare that to your city.
Open Street Map Instructions: Open Tool > You can use the + and - buttons at the top left to zoom. Click anywhere on the map and hold down your mouse to move around. You can also click on the magnifying glass underneath the + and - buttons, type in a location, and press enter to see a specific area. The map legend on the right explains map colors and symbols. The first category Bicycle Infrastructure is the most relevant to this.
NHTSA How Bikeable is Your Community? Checklist
Bicyclist Fatality Data can support your assessment of access to safe bike options, as it indicates that someone had a need to bike in a location but did not have a safe place to do so. The National Highway Traffic Safety Administration (NHTSA) Fatality Analysis Reporting System provides a start for this. It can tell you the number of cyclist fatalities in a county or city for the previous year, as well as the fatalities per 100,000 people. The latter is useful if you’re comparing to other cities with different populations.
NHTSA Fatality Analysis Reporting System Instructions: Open Tool > Under Data Visualization, click Pedalcyclists > On the left of the screen, click Geography and choose your city or county > At the right of the screen, click under the word State to choose your state. You can then click on your county or city to see the number of cyclist fatalities.
